Last week’s post looked at how the theory of “learning organisations” could be applied to a government and society seeking to learn how to build an economy that provides enough for everyone, drawing on Peter Senge’s seminal work The Fifth Discipline. This week I’m going to complete this analysis by looking at what Senge considered the most important of these disciplines, systems thinking.
As it happens, I studied systems theory and practice with the Open University nearly 20 years ago. It is a broad and rich field, with contributions from the study of biological and ecological systems, ICT systems, and organisational systems. Some of the lecturers on my course found Senge irritating, because he took one small element of systems theory – “system dynamics”, developed by Jay Forrester – and presented it as all there is to system theory. This is an entirely valid criticism, but equally I find system dynamics to be one of the most interesting areas of the field, and Senge’s presentation of it is very clear and insightful.
For this post, I am going to present a selection of certain concepts found within systems theory (not all of which are covered by Senge) and draw out their relevance to understanding economic systems.
First of all, we need a simple understanding of what a system is. A system is a connected set of “components” that produces an effect or outcome that is not possible unless these parts are connected in that specific way. In other words, remove one of the components and the system stops functioning (or produces different effects). Okay, that’s pretty basic, but it’s enough to get started!
Feedback loops and dynamic complexity
The essence of this concept is that two factors can mutually influence each other. It’s a simple, obvious idea, but it leads to impenetrable complexity. It’s easy to think of causation in terms of one event having a direct cause – “the ground is wet because it has been raining”. But in a feedback loop, there isn’t simple cause and effect, there are two effects that mutually influence each other.
This is easiest to explain using a systems diagram called a sign graph.
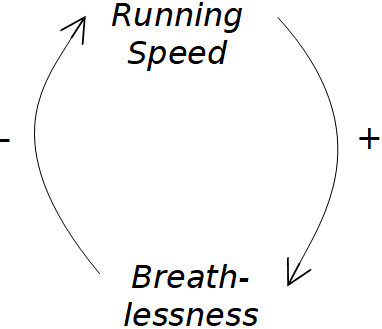
The diagram shows that if you run faster it causes you to get out of breath, but getting out of breath causes you to run more slowly. The “+” sign on the connecting arrow means that as the variable increases or decreases, so does the other (run fast = more out of breath, run slow = less out of breath). The “-” sign means that a change in the variable causes the opposite change in the other (more out of breath = run slower, less out of breath = run faster). In this example, running faster causes you to become breathless, which causes you to run slower: the moral of the story is that the quickest way to get somewhere is not always a sprint!
In a sign graph, if you have an even number of – signs (or only + signs), then you have a reinforcing feedback loop (a vicious or virtuous cycle): a change in one variable causes a change in the next, which feeds back round to the initial variable, causing it to change further in the same direction. If you have an odd number of – signs, then you have a balancing feedback loop. Increasing one factor in the loop starts a causal chain that eventually causes the original factor to reduce again.
Let’s look at the significance of this with another example. This one models people’s willingness to queue to buy a drink in a busy bar.
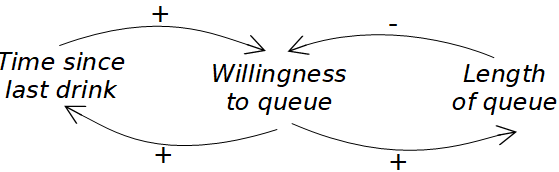
Taking the left hand loop first, the longer the time since their last drink, the more willing people are to queue – that’s obvious enough. And at the same time, the more willing someone is to queue, the longer they will wait until their next drink. And what affects someone’s willingness to queue … how long the queue is. If the queue is longer, willingness to queue goes down (hence the minus sign). But if people in the bar are less willing to queue, the queue will get shorter, so this arrow has a + because the two variables move in the same direction.
So in this example, you have two feedback loops operating on people’s willingness to queue; one is reinforcing, but the other is balancing. Whether the queue grows longer or shorter depends on which of these feedback loops wins out. And this balance of power will constantly shift, because the length of the queue itself is a causal factor on the rate at which the length of the queue changes! That’s the essence of feedback loops.
This is a trivial example, but already hopefully you start to see the complexity that can come when causality runs in these feedback loops. A couple more examples below (once we add in time delays) will hopefully show you the real value of these diagrams.
An accurate description of the dynamics of any situation involving people likely involves multiple connected feedback loops of this nature, creating great complexity. Being able to map these out, and being able to identify the reinforcing and balancing feedback loops, is a powerful tool to understand such complexity. Indeed, the simplicity of the elements of this diagram are its great virtue in using it to map complex systems.
However, this complexity is incredibly difficult to model mathematically. Think of it in terms of a spreadsheet. You enter a formula into cell C1:
=A1 x B1
This formula will take the value in cell A1 and multiply it by the value in cell B1. But if you then enter into cell A1 the formula:
=C1 / 4
you will get an error message in cells A1 and C1! Cell C1 is defined in terms of A1, and A1 in terms of C1, creating an infinite loop. Any system that contains such a feedback loop cannot be modelled using a spreadsheet, and in fact building systems that can mathematically model such feedback requires cutting edge programming.
Economist Steve Keen employed a leading computer scientist in complex systems, Russell Standish, to build a programme that can model such loops for the purpose of economic forecasting, funded by a mixture of grant funding, crowd funding and Keen’s own funds. The programme – Minsky – is open source and free. This video shows it in action.
Time and delay
If the effect of an action takes time to be happen, it can often be difficult to recognise the effect being caused by this action. The issue of time delays adds great complexity to the dynamic systems described above. Again, let’s illustrate this with a simple example. We’re going to add to our sign graph two short lines breaking an arrow to show a delayed reaction. This one shows the effect of a parent or teacher using shouting to control children’s behaviour.
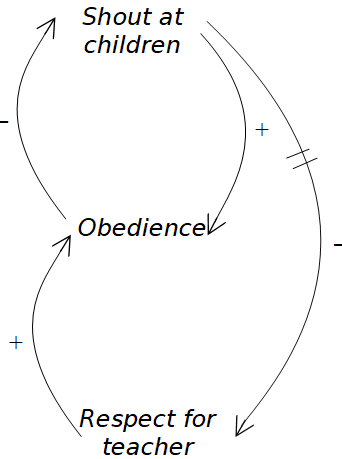
When the children behave badly, the teacher shouts at the children and gets an immediate response. But the children resent being shouted at, and over time lose respect for the teacher. This reduces their inclination to cooperate. All the teacher sees is that the children respond when he shouts at the children – he doesn’t see the delayed reaction as the children’s respect for him diminishes. As their behaviour gets worse over time, he shouts even more.
Economic conditions have multiple causes, operating in feedback loops that produce different effects over different time periods. But mainstream economists are famous for not understanding or being able to model the impacts of time (famous among heterodox economists, at least). The cause of a financial crash is almost never the policy of the government in power at the time, but rather the cumulative effect of policies over years and decades beforehand.
At this time of crisis, excellent papers are coming to the fore describing in detail the plumbing of how the financial system works. For example, I described 3 weeks ago how the crisis had caused a rush to buy dollars. This caused the price of US Treasuries to rise, while corporate bond prices crashed. Then after 9 March Treasury prices fell unexpectedly, causing the Fed to intervene in the market. This brilliant article by Carolyn Sissoko presents a hypothesis of why this happened. One cause she suggests is that falling corporate bond prices caused investors in mutual bond funds to withdraw their investments. The fund managers couldn’t raise the cash they needed by selling corporate bonds because their prices were plummeting, so they sold their US Government bonds instead. This surge of US bonds onto the market caused their price to fall.
Did you follow that? Well here it is shown as a sign graph:
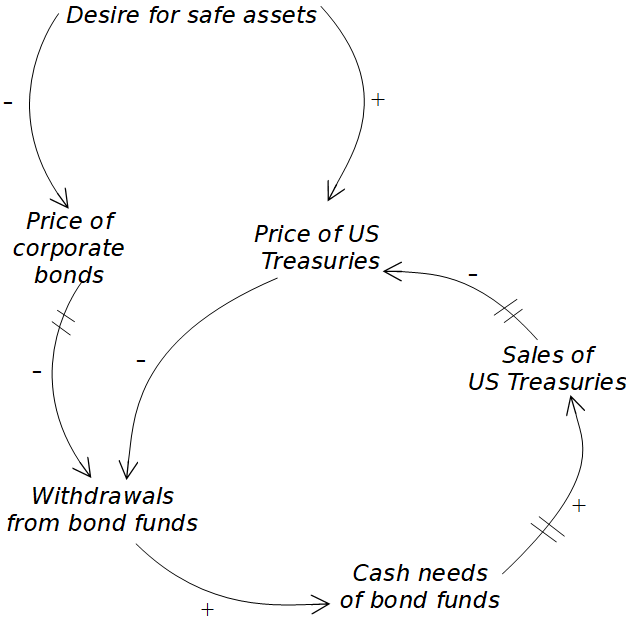
Notice at the top right, the immediate effect of the desire for safe assets on US bond prices. But as you read around the left hand loop there are three delays in the system. It takes time for the fall in corporate bond prices to provoke withdrawals from mutual bond funds, and then for these withdrawals to prompt fund managers to sell US Treasuries to raise cash, and then for these sales to impact Treasury prices. Once the system has created this dynamic, we have a vicious cycle feedback loop in which falling US Treasury prices further spooks investors and prompts further withdrawals.
The sudden change in a system condition is known variously as a “critical threshold”, “environmental threshold”, “critical mass” or “tipping point”. Economic systems can often operate stably for year or decades, until they reach such a point. Many economists and commentators will then look in the immediate past for a single cause of this sudden change. They don’t recognise that the instability was an inherent feature of the system’s operation all along.
Feedback loops and time delays create complex systems whose effects can change over time. Sign graphs are one way to depict such systems. What is more significant is having an internal model of such complexity when analysing economic (and other) systems.
Stocks and flows
In the sign graphs above, the text statements stated should always be written as something that can increase or decrease (either in quality or in value). A basic error would be to write “run faster” and “increased breathlessness”, rather than “running speed” and “level of breathlessness”.
Where this variable is a straightforward amount of something it is a stock. The rate at which this stock changes is a flow. Picture water flowing into a basin. The amount of water in the basin is the stock, the rate at which the water flows into it is a flow. The stock is a volume, the flow is a speed. The flow determines the rate at which the basin fills up. Similarly, price is a stock, the rate of inflation is a flow. By definition, flows are moving parts and harder to get a handle on. It is well known in systems theory that the flows in a system can be harder to see but far more important to understand.
Have you heard of calculus? Did it terrify you in maths classes? Do you remember converting equations y = f(x) into dy/dx =? This is all about rates of change – in other words about flows. dy/dx is the rate at which variable y is changing, and is called a first order derivative. You can then calculate the rate at which the rate of change is changing, known as the second order derivative!
All economics models, whether orthodox or heterodox, are full of these derivatives. One of the clever features of Keen’s Minsky software is that it calculates the derivatives for you (you don’t actually need to understand them to use the software). I don’t want to explain why these derivatives are so important, I just wanted to draw out the close overlap between this concept of systems theory and economic models. This blog post by economist Frances Coppola explains about derivatives and how they are often misunderstood by economics journalists (the same points would apply to reporting on coronavirus statistics).
But while economists understand the importance of stock and flows, they are not necessarily great at building models that reflect their mathematical behaviour. Some heterodox economists focus on this issue, and there is even a heterodox school of economic modelling called “stock-flow consistent”. In fact, the book that trained my mind to be able to understand the dynamics of economic and financial systems was a book of stock-flow consistent models – Monetary Economics by Wynne Godley and Marc Lavoie.
These models can have remarkable predictive power. Godley famously stated in his 1999 paper Seven Unsustainable Processes:
“Moreover, if, per impossibile, the growth in net lending and the growth in money supply growth were to continue for another eight years, the implied indebtedness of the private sector would then be so extremely large that a sensational day of reckoning could then be at hand.”
Eight years later, the global financial crisis began. During these years Godley and his collaborators at the Levy Institute continued to published papers warning of the impending crisis (see here and here in particular).
Coming right up to the present day, I like this paper by Byrialsen and Raza, published in January this year, that uses Godley and Lavoie’s modelling techniques to simulate the Danish economy. You can see the complexity of the model in the 23 pages of equations (pages 20-43). But just skip to the 10 pages of graphs (pages 44-54) showing the actual data of the economy compared to their simulation. It is incredible how closely they reproduce the behaviour of the actual economy across a wide range of variables.
Emergent properties
We’re back to the question of causation. The sign graphs above are useful for highlighting the multiple, interacting causes on any situation you want to analyse. But there is always an overall effect of the system that is not part of any single causal connection. Consider the diagram above about shouting at children, which could be considered a “system to make children obey”. The emergent property of this system is that children actually become disengaged and demotivated. System diagrams are useful tools for analysis, but their real power is in enabling you to step back and look at the whole picture. It’s a cliche, but systems practice is about being able to see the wood for the trees. In fact, as Senge puts it, it’s about seeing the wood and the trees.
Control systems
Command and control describes a style of management in which managers tightly define what workers should do and closely monitor and intervene in their work, in a rigid hierarchical structure. Senge makes the point that it’s well-known in business management that this is not an effective management style. Far more effective is to unlock the skill and creativity of your workers and allow them to flourish. But the minute an organisation hits a problem (i.e. falling business), managers panic and tighten the reins, which is exactly when they need to be allowing their staff to come up with creative responses to the crisis. These ideas are found throughout systems literature – see, for example, John Seddon’s excellent book, Freedom from Command and Control.
Linked to the idea of emergent properties, systems practice is about understanding the system as a whole, and how to create the conditions in which that system will function effectively. It involves being able to map and understand the dynamic complexity happening over time, to identify the resulting emergent properties of the system, and then to intervene at the “point of greatest leverage” to enable the system to function such that it produces the desired results.
This is exactly the role of Government that I have been arguing for in the economy (see here, here, here and here). In advocating a role for government, I never have in mind “command economies” associated with Soviet communism. This neatly draws out the relevance of systems thinking to the field of economics and the arguments in this blog.
Systems theory, learning organisations and economics
Senge argues that institutional learning is only possible through developing the skills of systems thinking. The reasons may not be obvious from this brief introduction to a few systems concepts, but it’s not important to me to make this point. My purpose in writing about learning organisations was merely to show that there is considerable research into this field, and my saying that we need to “learn” how to create enough for everyone is not a cop out – there is much that could be directly applied to the way we organise and govern societies.
Having introduced systems theory, next week I want to look more deeply at its connection with economics by describing the field of “systems of innovation”. This will also draw out in more detail the nature of the role of government in building an economy that provides enough for everyone.